hart-andersen-comparison

Goaltending is an integral part of the Stanley Cup Playoffs. To better understand the strengths and weaknesses of each goaltender, NHL.com charted 100 goals against each goaltender late in the regular season and through the first three rounds of the postseason to see the patterns that emerge. Here is the comparison between Carter Hart of the Vegas Golden Knights and Frederik Andersen of the Carolina Hurricanes, who meet in the Stanley Cup Final.

The Stanley Cup Final features two goalies who didn’t play much during the regular season but have been on top of their games while going wire-to-wire in the playoffs.

Frederik Andersen played 35 games in the regular season for Carolina while splitting time with Brandon Bussi, leaving some to wonder if the Hurricanes might continue using each in the playoffs. Carter Hart played 18 games in his first season with the Vegas Golden Knights and missed almost three months through early April with injury.

Now, Andersen is the third goalie in NHL history to win 12 of 13 in a single playoff, joining Ken Dryden (1976 Canadiens) and Gerry Cheevers (1970 Bruins), and his .931 save percentage leads all goalies to play at least five games. Hart is second with a .924 save percentage, just swept the favored Colorado Avalanche in the Western Conference Final, and has won seven of his past eight games after some ups and downs in the first round.

It’s hard to find many holes during hot streaks like those, but the team that can identify and target any tendencies has the best chance to hoist the Cup after this best-of-7 series.

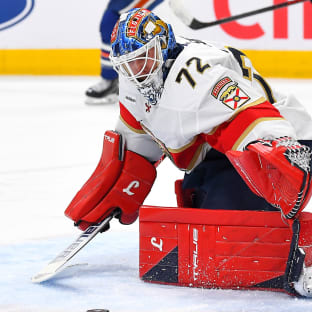
Carter Hart

Vegas Golden Knights

Hart earned the playoff starting job ahead of 2023 Stanley Cup winner Adin Hill by returning from a nearly three-month absence due to a lower-body injury and finishing the season on a 6-0-0 run with a .930 save percentage under new coach John Tortorella. There were only 46 goals to track in the regular season, but another 37 through a Western Conference Final sweep of the Colorado Avalanche added to the scouting report on a goalie in his second career NHL playoff run, even if there’s been little to pick apart the past two rounds.

carter-hart-goalie-breakdown

Blocker side? Even in these small sample sizes, Hart has a balanced goal chart that matches a balanced style. But the number of clean looks that went in blocker side on either shots coming down the right wing or from passes from that right side is a trend worth watching. It was in play on three of the seven goals against Colorado, a pass in each instance. Hart didn’t give up any goals between the blocker arm and body against the Avalanche, but three of four such goals against the Anaheim Ducks in the second round came on plays off the right wing, and six goals under that arm in the playoffs (16.2 percent) are still more than four times the 3.8-percent tracked average. Some came off great shots or screens and others off tough bounces, but Hart has a tendency to turn and reach on blocker shots rather than closing down and cutting them off in front of him that can open holes, and while a slightly flared elbow can help on high shots to the blocker, it can also delay the ability to seal it against his body. Colorado scored four of seven on the blocker side, including three high. Perhaps more telling, the Avalanche directed double the amount of shots to Hart’s blocker side compared to his glove.

Against-the-grain: Five of the seven clean-look goals in the regular season came on shots against the direction of play, part of a larger trend across several chance types that includes the above-mentioned trend of shooting to the blocker from right wing. The larger regular-season sample included a couple goals from higher in the zone, including lateral carries across the middle, with 14 total goals (30.4 percent) coming on shots against the grain, well above the 18.4-percent tracked average. It continued in the first two rounds with 11 of 30 goals (36.7 percent) involving an against-the-grain element and even with two more against Colorado, the total (35.1 percent) is still well above the tracked average.

Low or high glove? It’s important to remember goal totals are not save percentages but the nine goals (20 percent) under Hart’s glove in the regular season are almost double the 10.4-percent tracked average. That number was down to two (11.1 percent) in the first round, the only low-glove goal against Anaheim in the second round was a screened, against-the-grain shot from a dangerous area by Mikael Granlund in Game 6, and Hart was perfect on 13 low-glove shots against Colorado. Despite more goals high-glove in the playoffs, Hart’s “fingers-up” glove position does make it easier to access high shots but harder to turn the pocket down over the pad. The key may be the type of play: shoot over the glove after forcing him to move, but under the glove on straight-line attacks.

Beware stick working down low: Hart is active and effective with his stick trying to cut off passes from below the goal line. If you can avoid that stick with a pop pass out front, the reach delays his ability to cover the far side of the net. The Ducks scored twice that way in the second round and attacks from below the bottom of the face-off circles, including low-high plays from behind the net, were a factor on nine goals (19.6 percent) in the regular season, slightly above the 17.1 percent average, and 10 in the playoffs total (27.0 percent), including an Alex Killorn net drive in Game 4 against Anaheim that went in under the blocker arm after Hart turned his stick over in preparation for a potential poke check.


East-West and up: Forcing goalies to move from one side of the ice to the other is always a good way to increase scoring odds, but Hart has managed these plays well in the playoffs, with eight goals total and just two against the Avalanche. The totals were higher in the regular season with 14 goals (30.3 percent), above the 22.1 percent average. The only trend was the need to elevate on the other end of those plays. Only three were finished along the ice because Hart usually gets a good push into those plays and seals the ice. Part of that comes with more conservative depth and good rotation to the posts, which can also open a little more of the top of the net. On odd-man rush chances, he tends to go into a spread as he slides across, especially to the glove side, which takes away the bottom half of the net but gives him almost no access to the top. Even when he reaches rather than pushing on low laterals, a tendency more pronounced moving to the blocker side, Hart forces elevation on the backside. Gabriel Landeskog’s backdoor goal in Game 1 of the Western Conference Final is a great example of that.

Traffic and rebounds: Neither stood out as an issue in the regular season, but eight goals in the playoffs (21.6 percent) involved a screen, eight were scored off a broken play or bounces off a teammate, and five (13.5 percent percent) were scored on a rebound, each above the tracked average. Of course, that’s not how Carolina has typically generated offense in these playoffs. They might want to try, however, especially since Hart’s 24 rebound chances against are the second-highest total behind 31 for Jakub Dobes and he played three more games with the Montreal Canadiens.

VGK@ANA, Gm 4: Hart makes pad save on Killorn in 3rd period

Frederik Andersen

Carolina Hurricanes

Coach Rod Brind’Amour indicated before the playoffs he could use both his goalies after Bussi’s breakout led to split starts during the season, but Andersen made sure there was no need by sweeping through the first two rounds, then bouncing back from five goals against in a Game 1 loss to start the Eastern Conference Final by winning four straight, including a Carolina playoff record shutout streak (160:13) between Games 3-5.

frederik-andersen-goalie-comps

Breakaway dekes wide: Andersen gave up 21 “breakaway” goals in the regular season sample, and while that includes partial breakaways and some 1-on-1 chances in zone, it’s more than double the 10.2 percent average for the more than 10,000 goals tracked for this project since 2017. Some of that was Carolina giving up 71 such chances on Andersen, third most in the NHL, but there are trends worth noting, especially after Montreal scored four of its 10 goals off 1-on-1 situations. While the regular-season target seemed to be high glove (six goals), Andersen does a nice job of matching speed on long breakaways and forcing players to deke if they want to score. Dekes accounted for 13 of those 21 goals, and only two of those were put back between the five-hole, with the rest stretching him out wide. Ottawa went 0-for-5 in the first round trying to finish dekes between Andersen’s shorter-than-most pads, and Philadelphia failed on three in-tight moves to the five-hole in the second round, while Flyers forward Travis Konecny tried to shoot blocker side on two clear-cut breakaways and Andersen got a piece of each. The Canadiens scored two of their four breakaway goals by deking around Andersen, with the other two coming on a shot under the glove and another under the pads. Montreal also failed to convert three other breakaways: two shots and a five-hole deke.

Make him work for touches: One of the hardest parts of playing behind Carolina is a lack of shots, something goalies often try to make up for by handling the puck more often behind the net. Andersen is good with the puck on his stick too, so making it easy for him to collect simple dump-ins along the ice not only helps him feel the puck and stay engaged, but it can also kill the forecheck and kickstart Carolina’s transition game.

Work down low: Andersen gave up 22 goals on plays and passes across the middle of the ice, which is slightly below the 22.1-percent tracked average, but 16 came below the hash marks. That includes some of the 23 goals on plays from below the goal line or bottom of the face-off circles, well above the 17.1-percent tracked average, and two trends that stress the importance of attacking him from down low. It’s a trend that has continued in the playoffs, with three of five goals against Ottawa coming from plays that forced him to work into -- and off -- his posts, including his only clean-shot goal of the playoffs on a rush shot off the right wing by Dylan Cozens from just above the bottom of the circles that appeared to catch him preparing to transition into his post. There were two from passes from behind the net against Philadelphia and two more against the Canadiens, bringing the total to seven goals (35 percent) in the playoffs off sharp-angle plays and low-high passes.

CAR@MTL, ECF, Gm 4: Andersen shuts out Canadiens in Game 4

Back the other way: Against-the-grain shots accounted for 34.5 percent of last season’s tracked goals, and while the total was down to 28 percent this season, that’s still well above the 18.5 percent average. There were only three such goals in the first two rounds, but Montreal scored five goals on against-the-grain plays and shots. Off the rush, Andersen can get a little flat with his backward flow, which leaves the back shoulder off angle as shooters get deeper into the zone, something that can be exacerbated by his conservative depth. Add in a tendency to hold his blocker lower and it’s not a shock four of five clean goals were high to that side coming down the opposite wing.

Elevate on low laterals: While Andersen sometimes squares up on rush chances and plays out of the corner in a way that increases the rotation and distance required to push across on passes across the middle of the ice, for the most part he uses good play reading and neutral positioning to give himself a chance to at least get his backside pad across. That makes it vital to elevate quick shots on the other end of those plays. All five goals from those east-west plays in the playoffs have come on passes below the hash marks, but Lane Hutson’s goal in Game 3 of the East Final, which came on a give-and-go with Cole Caufield that crossed the middle twice, was the only one that totally stranded Andersen.

Managing the chaos: Andersen has excelled in the playoffs on screens (one goal), rebounds (one), and deflections (one), while his four goals (20 percent) from broken plays and bounces off teammates are tied for the fewest of any goalie to start at least five games. But he might need to be even better amid the crease chaos against a Vegas team that leads the playoffs with 29 goals attributed to those four factors combined, 13 more than Carolina has scored so far.

Related Content