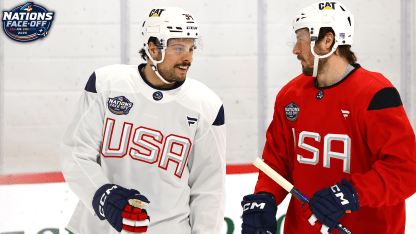
Hill Binnington Montembeault

In a short tournament like the 4 Nations Face-Off, goaltending could make the difference between success and failure for each of the four countries participating in the round-robin tournament that runs from Wednesday to Feb. 20. So, just like NHL.com has done since the 2017 Stanley Cup Playoffs, we’ve charted the goals given up by each nation’s goalies during the 2024-25 NHL regular season to better understand their strengths and weaknesses and see what patterns emerge that might be targeted. Today, it is Canada, which named Jordan Binnington the starter for when it opens the tournament against Sweden at Bell Centre on Wednesday (8 p.m. ET; MAX, truTV, TNT, SN, TVAS).

Jordan Binnington

St. Louis Blues

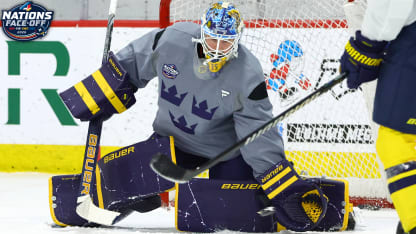
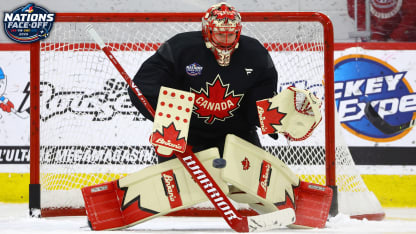
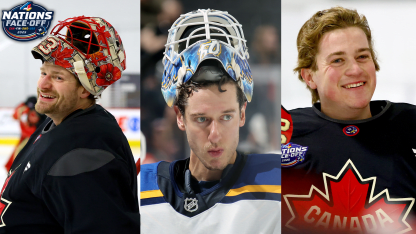
Binnington was named the starter over Adin Hill of the Vegas Golden Knights and Sam Montembeault of the Montreal Canadiens.

We’ll focus the majority of our tracking efforts on the two goalies who have won the Stanley Cup, starting with Binnington. He steadily outplayed the Blues’ sometimes porous defensive play during the five seasons that followed his 2019 Stanley Cup victory, but has struggled to do the same this season, with an .897 save percentage through 38 starts.

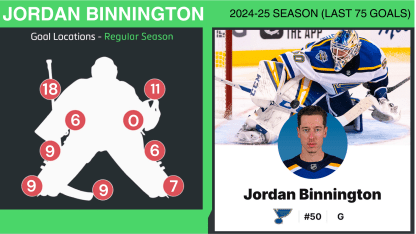
Jordan Binnington Goal Locations

East-west: Creating offense with passes and plays across the middle of the ice or slot line -- an imaginary line that splits the zone from the goal line to the top of the face-off circles -- has been an increasingly important part of creating offense for years, and Binnington has mostly handed it well. His 18 slot-line goals allowed (24 percent) are slightly higher than the 22 percent average for all goals tracked for this project, but there is a trend worth watching among them. Binnington tends to get outside his posts and squared up to plays on the perimeter along the board, increasing both the distance he has to travel and the amount of rotation required before making a good push, each of which makes it harder for him to get across in time when east-west passes connect.

… and fast too: That said, Binnington generates a lot of speed from his almost uniquely narrow stance, so you better not waste time after receiving one of those passes. One-timers and quick releases are a factor on 90.3 percent of his lateral goals against, and too much delay could give the hard-battling Binnington a chance to turn a sure goal into a momentum-changing save.

High blocker on clean looks: The 18 goals (24 percent) over Binnington’s blocker stand out not just because they are well above the 17.2 percent average, but also because they account for seven of the 10 goals he gave up on clean looks. On open looks from the other side, low glove may be a better bet because of the high, fingers up glove position that Binnington holds onto so patiently, often to the point where shooters fire the puck into his glove.

Dead angles and pop passes: This was a bigger issue during Binnington’s 2019 Stanley Cup run, when the goal totals on plays and passes from near or below the goal line were more than double his current total of 13 (17.3 percent). Binnington is great at not committing early to any specific post-play technique and will mix up which one he uses depending on the situation. Still, he can sometimes get caught in transition because he so often remains upright with the puck down low.
Adin Hill

Vegas Golden Knights

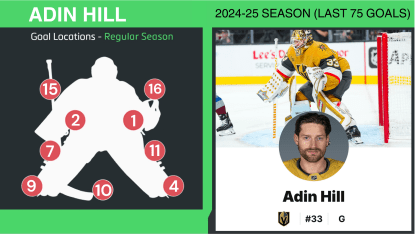
Hill, who won the Cup with the Golden Knights in 2023, has a .900 save percentage this season, tops among the three Canadian goalies, and we tracked his past 75 goals given up this season.

Adin Hill Goal Locations

Left to right: Rebounds accounted for 16 of the 75 tracked goals (21.3 percent), which is only slightly above the 20.6 percent average for the more than 8,000 goals tracked for this project since 2017. But 11 of those 16 rebound goals were scored on the blocker side, and a tendency to reach and dive, rather than rotate and push across, seemed more prevalent when Hill was moving to his right. That can often be a result of the initial shot quality, but most goalies are better moving one way than the other, and most are weaker when moving to the blocker side. Add in a tendency to kick at low shots with the right pad, which adds a delay to recovery and puts more rebounds into the middle rather than the corner, and attacking left-to-right makes sense.

Low-high and rebound scrambles: Forcing Hill to work in and out of his posts on plays from near or below the goal line is a good way to create rebounds and scrambles, which accounted for 20 percent of tracked goals, significantly higher than the 14 percent average. The tendency to reach on those plays can pull Hill off his goal line and result in him being stretched out rather than staying over his knees to shift back and forth on second chances in front. Low-high passes to quick shots and net-play chances accounted for 18 of the goals tracked (24 percent), also above the 17 percent average. Passes from below the goal line left him deep in the crease or still moving in an attempt to gain more depth, each of which creates a susceptibility to quick shots, and his skate-on-post integration creates a gap between the bottom of the pad and the post that led to two goals and is a spot players in this tournament are capable of targeting.

Deflections: Tips were the primary factor on eight goals, and although playing further back in the crease gives Hill a split second longer to react to open shots, the reality is most deflections are too close to allow a reaction, and his positioning makes it tougher to get close to the tip point.

Sam Montembault

Montreal Canadiens

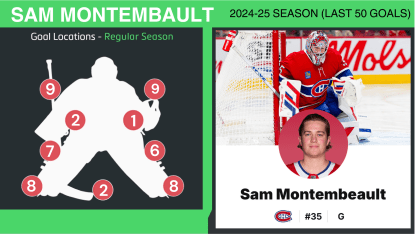
With each goalie seemingly ahead of Montembeault on the depth chart, having already won the Stanley Cup, we only tracked 50 goals on him and kept the breakdown shorter, but he is comfortable playing in Montreal and has had stretches of excellence this season.

Sam Montembault Goal Locations

In tight and wide: Goals along the ice, outside the pads, are often indicative of plays where the goalie is stranded and can’t get across, and Montembault’s total on each side (32 percent combined) is much higher than the tracked average (23.3 percent). Some of that is the high-quality, slot-line chances Montreal surrendered, but there was also a tendency by Montembeault to overplay things in tight where he made it harder on himself to recover. There were also a couple of instances in which he anticipated the wrong pass and took himself out of a play.

Traffic: Eleven screened goals (22 percent) are above the tracked average of 15.1 percent. Many of these goals Montembault didn’t have much of a chance to save, and he seems to use his 6-foot-3 frame effectively to try to look over the traffic in front, but he does tend to drift back from the top of his crease at times as he drops into a blocking butterfly rather than battling for a sightline.

Hold off rush: Lateral plays are an increasingly key part of generating offense, but five of the six clean goals Montembault allowed were the result of holding and shooting from above the dots.

Related Content