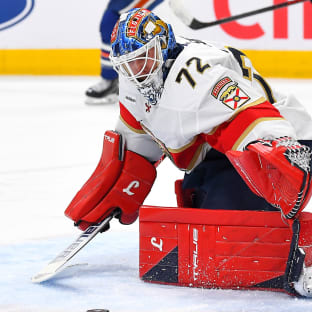
dostal_ingram_041826

Goaltending is an integral part of the Stanley Cup Playoffs. To better understand the strengths and weaknesses of each goaltender, NHL.com charted 100 goals against each goaltender late in the regular season to see what patterns emerge. Here is the comparison between Connor Ingram of the Edmonton Oilers and Lukas Dostal of the Anaheim Ducks.

The Western Conference First Round best-of-7 series between the Edmonton Oilers and Anaheim Ducks features goalies with very different pedigrees and expectations coming into the season. 

Lukas Dostal was always going to be the Ducks No. 1, and his season includes representing Czechia at the 2026 Winter Olympic Games. Connor Ingram started the preseason on a different team and the regular season in the American Hockey League before trades and injuries gave him a chance to play his way into the Oilers No. 1 job.

None of it matters now, but each team’s ability to identify and break down the tendencies of these two goalies could determine which team wins this series.

Lukas Dostal

In his second season as the Ducks starter, Dostal set an NHL career high with his first 30-win season despite finishing with a career-low .888 save percentage. Looking at the goal trends and quality of chances, especially on plays across the middle of the ice, it’s easy to understand why his save percentage dropped. If Anaheim can’t tighten that up against the Oilers, it will be up to Dostal to figure out how to get across more consistently.

Transition quick: Dostal’s tracked goals included 57 percent scored off the rush and rush-style chances off turnovers, well above the 35 percent average, one of the highest totals tracked for this project since 2017, and not a great indicator for the Ducks defending.

East-west down low: Lateral plays across the middle of the ice accounted for a whopping 37 percent of the tracked goals, well above the 22.1 percent average. In fact, the number of east-west goals below the hash marks alone (20) almost reached that mark. A lot of that can be tied to the Ducks defending deficiencies and aren’t all on the goalie. With so many open seams and backdoor tap-ins, there were trends worth noting. One was a tendency to stay squared on puck carriers outside his post lanes as they got below the face-off dot, which creates a much bigger rotation before being able to push across, and further to travel when he does. That trend seemed more prevalent on plays that started on his right, and that shows up with the 15 goals outside the left skate on the other side of those low lateral passes. A tendency to reach with the pad rather than push at times, again in part because of the degree of difficulty, combined with not having the length as a smaller goalie meant a lot of those plays beat his coverage to the post even along the ice.

East-west up high: Again, the quality of many of these chances after open passes through the seams make this as much about the defense as the goalie. But the 14 cross-ice goals above the hash marks came with different trends, including eight scored over the blocker compared to just one high glove. At times, it was simply about the quality of the chance, but a tendency to not rotate moving right made it harder to gain angle on six of those eight.

Bodies to the net: The 20 screen goals are well above the 15.1 average, but don’t appear to be a positional issue. Dostal got out to the edge of his crease on most, but even at the listed 6-foot-2, he doesn’t have the height to look over most screens. A lower, wider save stance forces him to try to look around, and he didn’t get a lot of help from defenders, who were often in wrong lanes. Plus, he doesn’t have the size to cover top corners. Add in 16 broken-play goals and bounces off teammates, and getting traffic in front of Dostal in-zone is important.

dostal_graphic_041826

Connor Ingram

Ingram started this season playing for Bakersfield of the American Hockey League after being acquired from the Utah Mammoth on Oct. 1, but the Oilers trade for would-be No. 1 Tristan Jarry, and a subsequent injury to Jarry, gave him a chance to show the Oilers he was capable of being their starter. His .899 save percentage this season may not jump off the page, but it’s the best of the four Edmonton goalies this season. Since the Olympics, Ingram is 10-6-2 with a .901 save percentage. He looks more comfortable behind late-season defensive improvements.

Balanced game: There are not a lot of extremes in the chart of his 77 goals allowed or goal attributes for Ingram. That's not shocking because he doesn’t have a lot of extremes in his tactical approach, playing mostly within his crease with the exception of taking early ice and retreating on rush chances and breakaways. The high glove totals are the biggest number, but 15 goals (19.5 percent) is below the average (21.1), and only four of those goals came off clean looks. The more notable trend, especially given that balanced positional approach, are the 21 goals outside of his skates, 20 (25.9 percent) of which came off plays in which he was stranded on the other side and couldn’t recover, well above the 16.9 percent average.

Low laterals: Unlike Dostal, Ingram’s 11 goals (14.3 percent) after east-west passes across the middle of the ice are well below the 22.1 percent average, but it’s worth noting nine of them came on plays and passes below the hash marks. A tendency at times to square to shooters from the face-off dots and below can leave Ingram stranded, especially if he has to widen out and lower into his save stance before a pass. That combination creates a much bigger rotation and longer push to get around and back to the far post.

Make him work off his posts: The low laterals were among the 18 goals (23.4 percent) on plays and passes from behind the net or below the bottom of the face-off circles, including low-high pop passes, a total above the 17.1 percent tracked average.

Mind the rebound locations: Ingram was around the averages on goals from screens (13), bounces off teammates (14) and offensive deflections (four), but his 11 rebound goals (14.3 percent) were slightly above the 11.7 percent average and included eight of the goals off the sides into empty nets. It’s important to be mindful that the rebounds off his Bauer pads travel further on purpose, with several out to the hash marks and bottom edge of the face-off circles, and two of the ones in tighter actually went in and out of his glove.

Breakaway dekes and against the grain shots: Ingram’s 11 breakaway goals (14.3 percent) are only slightly above the 10.2 percent average, but he comes well out on the clear cut chances, then widens and lowers in his stance as he retreats, which makes it harder to hold edges, increasing exposure to dekes (six) and shots against the grain (six).

ingram_graphic_041826

Related Content