Holtby

The time has come to take a look at the numbers that helped shape 2017.
In ascending order, here are 17 statistics calculated from Jan. 1 through Dec. 24, which includes part of the 2016-17 regular season, the 2017 Stanley Cup Playoffs (when applicable), and the beginning of the 2017-18 season.
Note: In most cases, team rankings do not include the Vegas Golden Knights, who played their first regular-season game Oct. 6.

.935:The League-leading save percentage for Carter Hutton of the St. Louis Blues (minimum 20 games played), up from a previous career average of .908. Hutton also leads in even-strength save percentage (.938) and ranks first with a goals-against average of 1.90.
0:The number of Arizona Coyotes who scored 20 goals in 2017. Rather than rely on a single scorer, the Coyotes spread their offense among their young players, like forwards Brendan Perlini and Christian Dvorak, each 21, who rank first and second on the team with 19 and 16 goals, respectively. The Coyotes also were without a 20-goal scorer in 2016.
1: Overtime goals in 13 games by the Winnipeg Jets, the fewest in the NHL. The Montreal Canadiens scored 13 overtime goals, including four each by Alex Galchenyuk and Max Pacioretty.

6:Penalty shot attempts by the San Jose Sharks, on which they scored two. That's at least twice as many attempts as every team except the Colorado Avalanche (five) and the New Jersey Devils (four). The Columbus Blue Jackets are the only other team with two goals on penalty shots in the calendar year, on three attempts.
10:Empty-net goals by Michael Grabner of the New York Rangers, out of 34 total goals. That's twice as many as any other player, and matches his previous career total. Grabner added an offensive spark to all defensive situations, with a League-leading 23 shots while shorthanded.
11:Game-winning goals by Filip Forsberg of the Nashville Predators, three more than his previous career total. Teammate Viktor Arvidsson finished second with 10.
15:Shootout attempts by Kyle Turris, including 10 with the Ottawa Senators, and five with the Nashville Predators. That's five more than Corey Perry of the Anaheim Ducks, who is second with 10. Turris scored five shootout goals, which is tied for first, of which a League-leading three were game-deciding goals.

29:Power-play goals scored by the Blue Jackets, in 228 opportunities, the fewest in the League. That's 10 fewer than the Carolina Hurricanes, who are with 39, and it's down from 50 goals in 229 opportunities in 2016. The Blue Jackets rank last with a power-play percentage of 12.7 percent, down from 21.8 percent in 2016.
41:Plus/minus by Jaden Schwartz of the St. Louis Blues, eight ahead of Nate Schmidt of the Vegas Golden Knights, who is second with a plus-33. Schwartz was minus-1 in 2016.
51:Goals scored by Nikita Kucherov of the Tampa Bay Lightning, four more than Forsberg, who is second with 47. With 101 points, Kucherov is one of three players to top 100 in 2017, along with Connor McDavid of the Edmonton Oilers (109) and Sidney Crosby of the Pittsburgh Penguins (108).

54:Wins by Braden Holtby of the Washington Capitals, first in the NHL. That's up from 45 in 2016, which was second.
60.0: Face-off winning percentage of Ryan O'Reilly of the Buffalo Sabres, the highest among players to take at least 100 draws. O'Reilly won 1,214 of 2,023 face-offs, each ranking second to Crosby, who won 1,225 of his 2,457 face-offs. With six penalty minutes in 80 games, staying out of the penalty box is a reason O'Reilly was able to take and win so many face-offs.
86.2:Penalty-killing percentage for the Los Angeles Kings, up from 80.8 percent in 2016. The Kings allowed a League-low 35 power-play goals, down from 56 in 2016. The Kings use their top players when killing penalties, including defenseman Drew Doughty, who had a team-leading ice time of 220:44 shorthanded, and Anze Kopitar, who led forwards with 158:22 of ice time.
283:Shots blocked by Kris Russell of the Edmonton Oilers. Ian Cole of the Pittsburgh Penguins (228) and Ryan McDonagh of the New York Rangers (209) are the only other players with more than 200.
387:Shots by Alex Ovechkin of the Capitals, 23 more than Vladimir Tarasenko of Blues, who was second with 364.
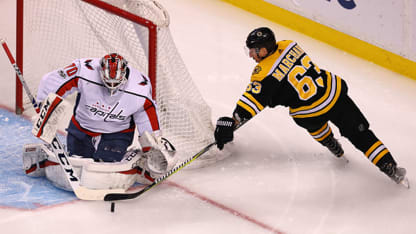

519:Shot attempts differential for the Boston Bruins, based on taking 3,920 shot attempts at 5-on-5, and allowing a League-low 3,401. This works out to a League-high SAT percentage of 53.5 percent.
1028:Washington's SPSV at 5-on-5 during the regular season, which is the sum of its League-leading 9.6 shooting percentage, and its .932 save percentage, which ranks third. Going back to 2009-10, the first season the statistic is available, Washington's SPSV ranks second to the 2011 Boston Bruins (1032).