Tracking_CotsonikaBadge

SAN JOSE -- How are teams going to use data from the NHL Puck and Player Tracking system once it is installed throughout the League next season? How are they going to find competitive advantages? Make better decisions? Win more games?

The NHL, SAP and Apple asked the same questions when they developed the SAP-NHL Coaching Insights App for iPad. When you hear the answers they received, and look at the product they created, it's easy to see.
"We sat down with a lot of the coaches on the teams and said, 'If you had this information, what is it that you want?' " Dan Fleetwood, SAP vice president of global sponsorships, said during a panel discussion at the 2019 All-Star Innovation Spotlight presented by SAP on Friday.
RELATED: [NHL to deploy Puck and Player Tracking | Tracking system to enter next phase]
The coaches gave them a list of data points they wanted on the bench instead of between periods or after the game when they could see the stat sheets.
"Each one of them said, 'This is going to impact the way that I play this game, this night, and these are the in-game decisions, and if I have this information at my fingertips, it's going to change the way that I make decisions,' " Fleetwood said.
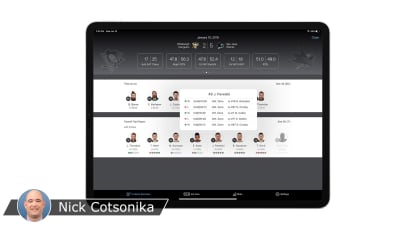
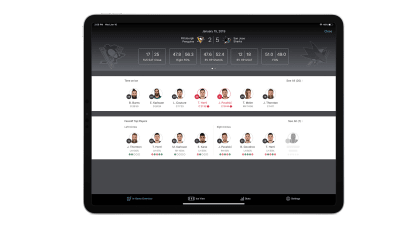
Take ice time. The app will allow them to track each player's ice time in real time, from the total, to the total in each situation, to the number of shifts, to average shift length.
Not only that, it will allow coaches to set thresholds and see projected times. Say a coach wants a player to skate for 20 minutes. If the player projects to exceed that, his number will go red.

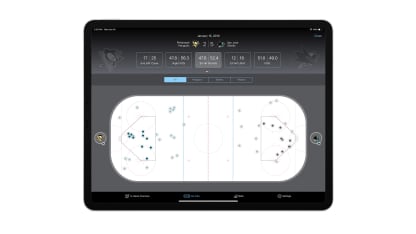
iPadPro13-sports-screen-1

Take face-offs. Coaches can see real-time percentages, sorted by handedness, circle and opponent.
Under the headings of left circles and right circles are the players' headshots and names, and whether they are left- or right-handed. There is their percentage. Their last five face-offs are shown with red x's or green checkmarks.
Take shot location. Coaches can see where they and their opponents are shooting, and they can see, say, their percentage of even-strength shots in high-danger areas.
The screen shows a rink, with home-plate-shaped areas in front of each net. Color-coded dots represent each shot. Touch a dot, and it shows who shot the puck, what type of shot it was, what the situation was and when it was taken.
"I mean, it's that kind of stuff," Fleetwood said. "That's what we were trying to design around. Within one or two swipes or clicks, how do we surface that for you?"
The app will be available in February after the NHL delivers iPad Pros to each team. For the rest of this season it will rely on data collected by humans. Once the NHL Puck and Player Tracking system is operating next season, the data will be more precise.
As the coaches learn the app and what is valuable to them they can customize the settings. The app can evolve in the future and add more types of data.
"I don't want to be a dinosaur," Calgary Flames coach Bill Peters said. "I want to be open-minded, so I'm sure there's going to be something there. As we get the tracking system in and understand what it is all about, I'm sure there are things we can take out of it."
iPadPro13-sports-screen-3

Some teams are already using tracking systems on their own. The Winnipeg Jets include heart-rate monitors, though they make those optional for players. Jets coach Paul Maurice said they look for sequencing, trying to find patterns that lead to success.
Say a player went on a phenomenal run after an injury.
"I need to know why," Maurice said. "What happened? What changed?"
Say a player performed well or poorly. Maurice can show him what that looks like in the data.
" 'This was your shift length. This was your heart rate. You got to that speed nine times last game,' " Maurice said. "Or maybe it's the opposite. Maybe it's, 'You never, ever got over that speed. You let the game come to you.' You hear players say, 'I let the game come to me.' I'd like to dispel that myth, that they should be letting the game come to them."
There is a difference between knowledge and wisdom. Say the data show the players skated a lot of distance. Is that good, because they had energy? Or bad?
"So in these three games I know we've covered way more ice, probably because we didn't have the puck," Maurice said. "We're checking more. We're covering more ice. There's more hits per minute on the ice.
"Like, Blake Wheeler. He's probably the fittest guy that we've got. If you found out that his heart rate didn't get down far enough for him to recover, now you've got a problem, or a potential opportunity to take the next day off and maybe make your team better."
In the end, as always, the data are only as good as the people interpreting and applying it.