tracking_cotsonika_012419

How fast did Edmonton Oilers center Connor McDavid skate on that rush? How hard did San Jose Sharks defenseman Brent Burns shoot that puck?
We're about to find out.

We'll learn things we never knew before when the NHL enters the next phase of research and testing of the NHL Puck and Player Tracking system at the 2019 Honda NHL All-Star Weekend in San Jose.
RELATED: [Complete All-Star coverage]
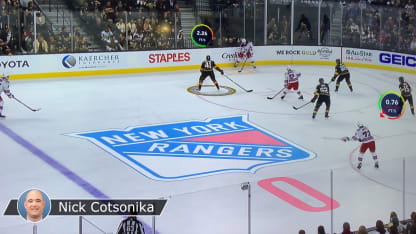
Each player will wear a sensor about the size of an Oreo cookie on the back of his shoulder pads. Forty pucks will have the same type of sensor embedded in frozen rubber. The sensors will emit signals about 200 times per second to 14-16 antennae at SAP Center for this event, though the sensors in the pucks can emit signals up to 2,000 times per second.
That will generate millions of data points and allow NBC and Rogers to bring new insights to their broadcasts of the 2019 SAP NHL All-Star Skills on Friday (9 p.m. ET; NBCSN, CBC, SN, TVAS) and the 2019 Honda NHL All-Star Game on Saturday (8 p.m. ET; NBC, CBC, SN, TVAS).

tracking_ipad_012419

The technology will enhance the storytelling, bringing an unprecedented level of precision to description. For more than a century of NHL play, people have had to rely on adjectives for speed and estimates for distance. Now the NHL has the tools to give exact measurements.
There is an art to presenting the science and that will be up to the broadcasters, who tested the system when the Sharks defeated the Vegas Golden Knights 3-2 at T-Mobile Arena on Jan. 10 and are still finalizing specific elements.
"I think we're going to leave it to them to decide what to show and when just based on the natural flow of the skills competition and the games themselves," said David Lehanski, NHL senior vice president of business development and innovation. "Obviously they're the experts in storytelling. They're the best at dealing with short stoppages and unique twists and turns during the game."
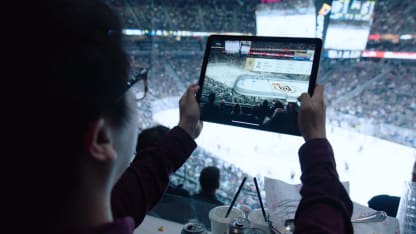
NBC will include some elements in its main TV broadcast. For those who want more, it will provide a second-screen digital stream showcasing live puck and player data on NBCSports.com and the NBC Sports app. The stream will be produced out of its own truck, called by its own broadcast team of Kenny Albert and Keith Jones, and feature graphics with real-time stats like skating speed, shot speed, shift times and total ice time.
Both NBC feeds will be piped to screens inside SAP Center, and some puck and player data will be shown on the center-hung video board.

tracking_fan_012419

"We know enough to know that the broadcasters really want it and they're going to use it," Lehanski said. "There is a tremendous opportunity to use this to not only enhance our current digital products but create entirely new ones. I don't think it's a leap to think that in the near future they're going to be live streaming products out there that are going to let fans completely customize what they see."
For now, we won't have enough data to provide context to the descriptions. OK, McDavid is skating X miles per hour. We knew he was fast, we know how fast he is now, and that adds to our level of appreciation of him as an athlete and of hockey as a sport. What we still don't know is how that compares to his record speed, his average speed, his slowest speed, his last shift and so on, let alone how it compares to other players.
But the more the NHL does this, the more we crunch the numbers, the more ways we will be able to appreciate and analyze the game. Shot attempts have been used as a proxy for puck possession because we haven't been able to measure just how much a player or a team has the puck. Well, now we'll be able to.
Lehanski uses goalies as an example. For decades, we've mostly used two statistics: goals-against average and save percentage. In recent years, we've refined that somewhat, but even measuring, say, save percentage on high-danger scoring chances has been imprecise. Now we'll be able to know exactly where each shot was taken, how fast it was moving, whether it was deflected and so on, and we'll be able to sort by game situation.
tracking_homepage_012419

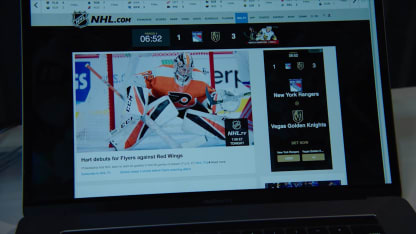
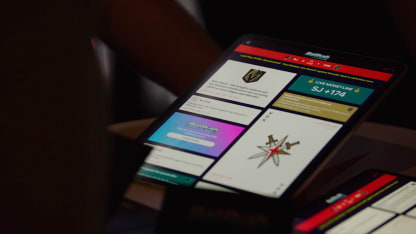
The data will also enhance a multitude of fan experiences including sports betting/gaming.
"It is going to take a little while to comb through the data and really understand where all the value lies, because it's just going to be a massive undertaking in the beginning," Lehanski said. "What will be most obvious in the beginning is what you'll see in the broadcast and in the streams. It's the visualizations. That will be probably the element that everybody really talks about. 'I like it.' 'I don't like it.' 'That was really cool.' 'I can't believe how fast that shot was.' Over time, there will be enough data there to start to really see patterns and new stories."