Saying a player - or a team - tilts the ice means that they are getting more shots than their opponent either by generating more and/or by preventing the other team from creating offense of their own. The greater the disparity between what each side creates, the greater the advantage for the side with the larger shot volume.
We see this often presented as a percentage: a player / line / team had X-percent of all shot attempts. But numbers can sometimes feel too sterile or don't resonate with what the actual impact is on the ice. But what if we can see what this actually looks like?
Let's dig in.
Going by the numbers,
bundled by Geico
, we know that Monday versus Ottawa there was one Kraken line that dominated play. The Yanni Gourde, Jared McCann, Karson Kuhlman combination tilted the ice more than any other in the game. According to NaturalStatTrick.com, in 8:58 of 5-on-5 play, when this trio was on the ice, the Kraken had 12 shot attempts. Ottawa had five. That's a 70.59 percent advantage for Seattle, which is pretty significant. Even more notable, this performance came when most of those minutes (6:37 - 6:57) were against the Senators' top line of Brady Tkachuk, Josh Norris and Connor Brown.
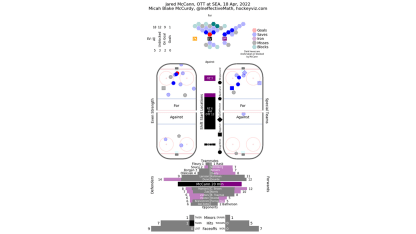
Yes, those numbers feel impressive. But what does that mean actually happened? Let's start with McCann. Not only was he part of this impactful line, but he had a goal and in all situations he led all skaters with eight shot attempts.
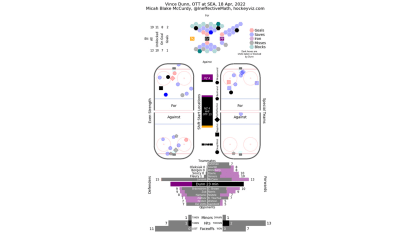
HockeyViz.com's Player Detail charts (by game) let us see what went down on the ice.
Let's focus on the two rink visuals within the bigger Viz below. The one on the left side below shows even-strength play, the rink on the right shows special-teams play. The top half of each rink shows shots the Kraken had, the bottom half are shots by the opponent (in this case, Ottawa). (There is teammate and opponent playing time detailed under that).

