NBC_BehindScenes_Tracking

SAN JOSE --The 2019 Honda NHL All-Star Game paused for commercials Saturday. On a headset in an NBC Sports truck outside SAP Center, producer Stephen Greenberg spoke to analyst Keith Jones.

"Let me show you something, Jonesy," Greenberg said. "Take a look at your monitor."
From his perch in the press box, Jones watched replays enhanced with data and visuals from the NHL Puck and Player Tracking system.
RELATED: [Complete All-Star Game coverage]
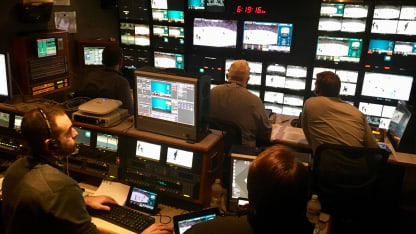
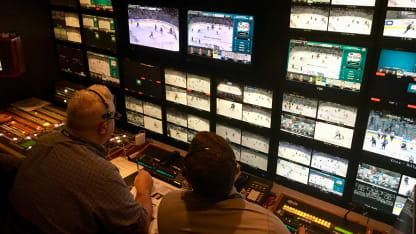
The inside of the truck looked like NASA Mission Control, packed with screens, switches and buttons, and as NBC came out of the break the crew counted down as if this were a rocket launch.
"Three …
"Two …
"One …"
Just like that, Jones used the new tools to give viewers better insight.
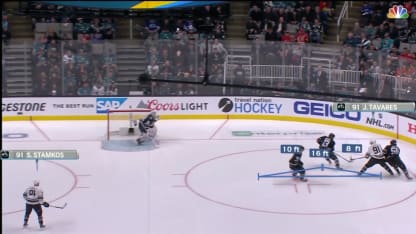
A gray trail showed the path of the puck as defenseman Seth Jones and center Jack Eichel finished pretty passing plays. A blue triangle showed the distances between players who bunched up defending center John Tavares, while another center wearing No. 91 went to the net.
"Watch the defensive coverage here," Jones told the audience. "Three Metropolitan players on one side, very close to each other, and that leaves this guy, Steven Stamkos, to go to work and score the prettiest goal of the All-Star Game so far."
NBC_Tracking

This was an experiment.
The NHL has spent years developing Puck and Player Tracking and will install the system in all 31 arenas next season. Sensors in pucks and on players send signals to antennas in the rafters, creating millions of data points and mountains of real-time information.
The plan is to enrich TV broadcasts without distracting from the game, to give more to hardcore fans and draw in casual fans. But it will take practice to find the right balance, and this was the first attempt.
NBC sprinkled some of the new data into its main broadcast. It was more aggressive on a second-screen broadcast on NBCSports.com and the NBC Sports app, which had its own production truck and its own broadcast team of Jones and play-by-play voice Kenny Albert.
"We wanted to overdo it," Greenberg said. "We wanted to throw everything out there and get people's reaction -- hockey fans and casual viewers alike."

Stamkos_Tracking

They tried things for the sake of trial and error, turning new features on and off. Greenberg had to look at all the usual screens while deciding when and how to incorporate the new data. Albert and Jones had to decide when and how to weave the new data into their calls and analyses.
"It's going to take us all time from a broadcast perspective to know what's important and what's not," Jones said. "It's just in its infancy. It's got a ton of potential."
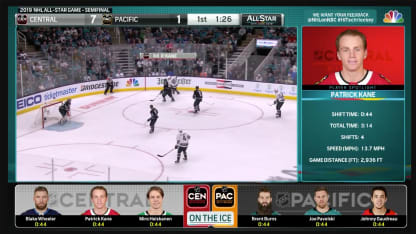
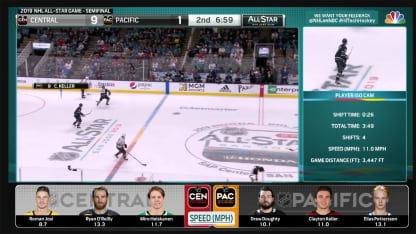
Nameplates called pointers identified players as they moved, sometimes also giving shift length, skating speed or distance traveled. A rail along the bottom of the screen showed headshots of who was on the ice, with the players' shift length, skating speed or distance traveled underneath. A rail on the right side of the screen showed other information, from shot speeds to offensive zone time, and sometimes an iso cam highlighting a certain player. Gray trails showed the path of the puck; blue trails showed the paths of players.

Kane_Tracking

"We grew up without having the score and time on the screen," Albert said. "Now they have all kinds of stuff on the screen. This next generation's also used to multitasking. They're not just sitting and watching TV. They're looking at their phone. They're looking at their iPad or computer, so by having all that stuff on the screen, I don't think it becomes much of a distraction for the younger folks."
When NBC showed shift length, the numbers turned yellow at 30 seconds and red at 45 seconds, indicating the player was running out of gas. Defenseman Erik Karlsson was deep in the red at one point but ended up on a breakaway. He scored even though he was on the ice for 1:22. The replay showed he was skating 15 miles per hour.
"We can use that to say that it's amazing the energy you find when all of a sudden your eyes light up and you've got a breakaway opportunity no matter what position you play, right?" Jones said.

Keller_Tracking_ISO

When the Central Division had a 10-4 lead against the Pacific, Albert pointed out that the Pacific had more time in the offensive zone despite the score. That's something he never could have done before. The numbers were skewed because this was a 3-on-3 exhibition tournament full of breakaways. But this could be applied in the regular season or the Stanley Cup Playoffs.
"Sports fans are used to seeing, for example, time of possession in football, and that can tell a big story in terms of how that game's going," Albert said. "It's not really an official stat in hockey, but I know some teams track it. I think that's really cool to see."
NBC monitored feedback on social media and made adjustments based on it. By the championship game, Greenberg toned down the pointers. Viewers seemed to like the puck trail and the shift lengths at the bottom of the screen.
"We'll debrief with the visualization company and the League and we'll figure out next steps," Greenberg said. "Obviously the League has the intention of doing this next year, and there's stuff you can implement pretty quickly into a broadcast that is going to enhance the game."