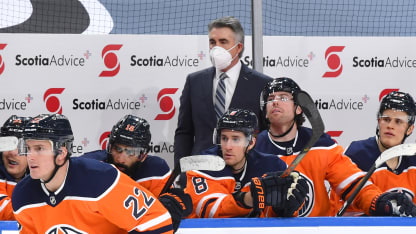
Dave Tippett, EDM

The SAP-NHL Coaching Insights App for iPad, upgraded with new features in Version 3.0 this season, is helping NHL coaches get the most out of their players in new ways.

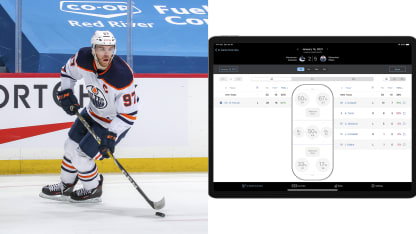
Take Connor McDavid, the NHL leading scorer with 84 points (28 goals, 56 assists) in 47 games. Edmonton Oilers coach Dave Tippett wants to play the center as much as possible but must manage his ice time to keep him fresh.
Tippett no longer has to guess on the bench or wait for numbers between periods.
"I'll just say, 'Where's Connor at?' " Tippett said.
An assistant can tap his iPad Pro and give Tippett instant, accurate data from the app, such as how much McDavid has played in game time or how much he has rested in real time as of that second.
When the Oilers played at the Winnipeg Jets on April 17, McDavid skated 8:55 in the first period, a significant amount. But Tippett didn't feel he was overtaxing him, because he managed his shifts around TV timeouts and could track everything.
"I knew exactly where he was," Tippett said.

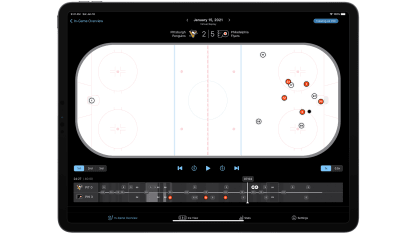
app-replay

McDavid had an assist in the second period and another in the third in a 3-0 win. Total ice time: 24:38.
He leads NHL forwards in average ice time (22:39) and all NHL skaters in points per 60 minutes 5-on-5 (3.36) among players to play at least 10 games.
"Helpful information is available quicker so it can have more impact," Tippett said.
The NHL has been exploring, developing and incorporating innovative technology to enhance the game for years, working with leading companies like SAP and Apple.
The League placed iPad Pro on the benches at the start of the 2017 Stanley Cup Playoffs, providing in-game video. It launched the SAP-NHL Coaching Insights App for iPad in early 2019, providing more than 140 real-time stats teams could filter and customize.
When the 2019-20 season was paused due to concerns surrounding the coronavirus, the NHL held a video conference with each of the 31 coaching staffs.
"Getting the feedback from coaches, that's always the huge priority for us," said Chris Foster, NHL senior director of digital business development. " … We want them to use [the app]. We want this to be a value-add."
Each workshop included five to seven team staff members and lasted at least an hour. Some lasted two hours.
Some of the game's biggest names were engaged, including Florida Panthers coach Joel Quenneville, who has 957 regular-season wins, second to Scotty Bowman (1,244); 119 Stanley Cup Playoff wins, third to Bowman (223) and Al Arbour (123); and three Stanley Cup championships.
"He asked great questions," said Brant Berglund, NHL senior director of coaching and GM applications. "He made sure that he basically was aware of what was in the application, because he was going to delegate responsibilities out from it. 'Hey, this is really good here. It would be good if we could stay on top of this for tracking this.' "

McDavid, App SAP

The feedback led to a variety of new features in Version 3.0 of the app this season.
Previously, each team had access to two IPad Pro at the arena on game day. But game day was so hectic, coaches didn't have enough time to explore all the layers of the app, and they wanted to use it between games in preparation. Now each team has unlimited access to two IPad Pro and game-day access to two more.
Oilers video coach Jeremy Coupal said the unlimited access was the No. 1 change. If coaches want to dig into something, they have more time to do it. The app also now allows them to review all games within the season and filter stats in additional ways.
"I like to play around with it," Coupal said. "The data changes, right? So you're reading a new book every time, game to game."
Previously, the app had detailed face-off information: wins, losses and percentages that coaches could filter by individual matchups, handedness, situations and locations. But coaches wanted everything on one page.
"We really just listened to the need, and then we tried to make sure that the experience wrapped around the need," Berglund said. "… You really can tap on everything here, and within 10 seconds you could determine, 'This center's going out, and we want the face-off to be on the left side of the ice.' "
The information can be especially useful late in a game, when there is a large enough sample size from that game from which to draw, and during a timeout before a key face-off, when coaches have a few extra seconds to digest info.
"I can grab that data," Tippett said. " 'OK, I've got [left-handed center Leon] Draisaitl on the left. Where's he at with the right-hander on the right?' … You have to have a feel for what's going on. It's not an every-time occurrence by any stretch. But there might be situations where it becomes critical, say, whether I use a left-hander or a right-hander on the face-off."
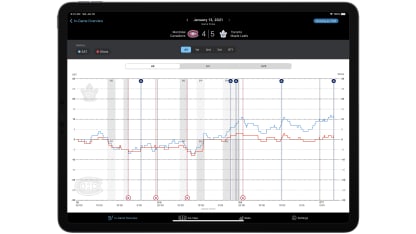
The app now features "Game Pulse," a timeline graph that shows momentum swings in a game by plotting customizable team shooting data.

app-game-pulse

For example, coaches can define the "home plate area" based on what they consider the high-danger area in front of the net, generally the shape of home plate in baseball. They can see the percentages of shot attempts each team makes in those areas as they rise and fall during the game.
Tippett looks at "Game Pulse" after games.
"Sometimes it's crazy," he said. "You think, 'Well, we were playing poorly,' and then you look at that, and you go, 'You know, I think we're all right.' Other times, you think you're playing well, and all of a sudden, you look at that and go, 'We weren't quite as good as I thought we were.' "
The NHL installed Puck and Player Tracking in each of its 31 arenas this season.
The NHL detected a manufacturing issue on the external layer of the tracking puck in the opening week and removed it. The puck is being tested, and the NHL hopes it will return this season. When Puck Tracking is fully operational, the app will show puck zone time and "Virtual Replay," a dynamic whiteboard that displays the puck and players as animation motion graphics.
Player Tracking has been fully operational all season, with players wearing sensors in their jerseys. It has been providing coaches with players' speed, including distance traveled, average speed 5-on-5 and max speed 5-on-5, but they're still figuring out what the data mean. For instance, is distance skated a better indicator of workload than ice time?
"This is a brand-new world," Foster said. "These are metrics that clubs have not used, and we are just scratching the surface here. And so, from a League standpoint, it's, 'Let's get this information to the clubs, do it in a way that's digestible. We'll get the feedback.' But how are they going to use it? That's when it gets really interesting, and how we're going to build on top of that."
This is only Version 3.0. Just wait for 4.0 and beyond.