Grubauer_Jones_Matchup

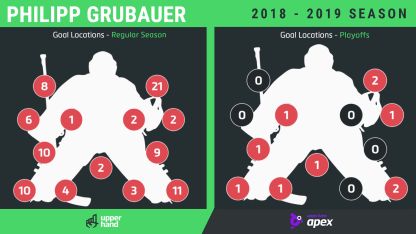
Goaltending is an integral part of the Stanley Cup Playoffs. To better understand the strengths and weaknesses of each goalie, the 100 most recent goals allowed for each in the regular season and every goal in the playoffs were charted, with the help of Apex Video Analysis and Save Review System from Upper Hand Inc., to see what patterns emerge.

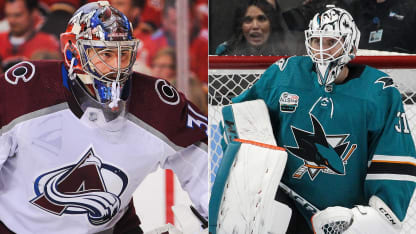
An up-and-down season for Martin Jones of the San Jose Sharks continued in the Western Conference First Round against the Vegas Golden Knights. He was pulled in two games before winning the final three, including a 58-save double-overtime victory on the road in Game 6 and a wild comeback and late blown lead before winning Game 7 in overtime.
RELATED: [Complete Sharks vs. Avalanche series coverage]
Philipp Grubauer of the Colorado Avalanche saw his regular season repeated in the first round as well. After a slow start in Game 1, Grubauer was dominant in the next four to eliminate the Calgary Flames, finishing the best-of-7 series with a .939 save percentage.
The ability of each goalie to stay on a roll could determine the winner of the Western Conference Second Round. Game 1 is at SAP Center on Friday (10 p.m. ET, NBCSN, CBC, SN, TVAS).
Here is an in-depth look at each goalie's game:

Philipp Grubauer, Colorado Avalanche

After a slow start to his first season with the Avalanche, Grubauer dominated down the stretch, going 7-0-2 with a .953 save percentage in his final nine starts to help them clinch the second wild card into the Stanley Cup Playoffs from the Western Conference. Unlike last season, when Grubauer similarly finished strong with the Washington Capitals but was pulled after two playoff starts, the hot streak extended into the postseason.
He allowed 10 goals in the five games against the Flames, so there was not a large sample size from which to identify trends, but some habits carried over from the regular season.

Grubauer-goalie-graphic 4-24
GOAL TRENDS

Sharp-angle attacks:Ten of the 89 goals (11.2 percent) Grubauer allowed in the regular season involved post-integration tactics and technique. In the first round, two of 10 were of that variety, with a third coming off a low-high play, so attacking from sharp angles is not a bad idea. Calgary forward Andrew Mangiapane scored the first goal of the series on a net drive from just above the goal line that saw Grubauer push out from the reverse-VH position on his post rather than across, leaving him sprawled and unable get to the far post. Grubauer also tends to set up outside his post or use a traditional VH technique, with his lead pad upright against the post, on rush chances form sharp angles above the goal line. That delays his ability to get across to the far post and led to three wraparound goals during the regular season.
Rebound splits: Grubauer was noticeably above the tracked average (21.1 percent) for rebound goals. Last season it was 26 percent, and this season he gave up 27 of his 89 goals (30.3 percent) on rebound chances. There was only one against the Flames, but his tendency to extend into the splits on lateral plays and recoveries makes it important to have second-chance support around the net and make sure those opportunities are put back on net at least 11 inches off the ice.
Glove hitch gone: Grubauer's early playoff exit last season was tied in part to a bad glove-hand habit the Columbus Blue Jackets exploited. He would turn his glove down over his pad as he got set for a shot and it often left him playing catch up on high shots. That hitch is mostly gone, but Grubauer still tends to hold his glove at or below his hip. Though there seems to be a conscious effort to keep it higher, he is prone to getting passive with it when he moves,, something the Flames targeted.
Against the grain:Grubauer was beaten 23 times (25.8 percent) in the regular season on shots and plays that caught him moving the wrong way, well above the 16.9 percent average. He uses a narrow, upright stance and exceptional patience to make up for being on the small side at 6-foot-1 and shifts actively into shots, which can leave him susceptible to deflections and rebounds.
Martin Jones, San Jose Sharks

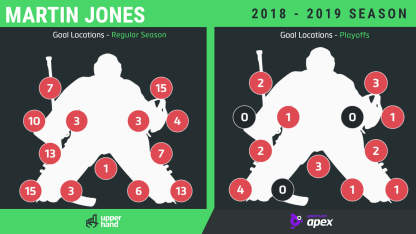
The play of Jones against the Golden Knights in the first round mirrored his regular season, which he finished with an NHL career-low .896 save percentage. There was uncharacteristic positional aggression early in the season against rush chances that left him off angle and beaten on clean shots from distance, perhaps a function of how many he faced this season and a sign the sagging numbers aren't all on the goalie. By the end, Jones was deeper in his crease and quieter in his movements, though some of the targetable tendencies and inefficiencies in his game remained.

Jones-goalie-graphic 4-24
GOAL TRENDS

Beat the rush:Scoring plays on the rush accounted for 54 percent of the goals tracked for Jones in the regular season, well above the 39.2 percent average recorded for 5,500-plus goals the past three seasons for this project. There was a lot of cross-ice passes on those rushes, high-quality chances that likely contributed to a tough season statistically, and the rushes continued early against Vegas. All seven rush goals came in the first four games, including consecutive goals before Jones was pulled in Game 2, when he was beaten by clean far-side shots after losing his angle. Jones was well outside his crease on each goal; he appeared to back off that depth while not giving up a rush goal the final three games, a simplified approach more typical of Jones in past seasons.
Left to right:Most goalies have a direction of movement that is stronger. Jones has traditionally been better going to his glove side, with a lack of early rotation moving in the other direction leaving him more likely to push across flat instead of back toward his post. That has left him chasing plays and stranded outside his crease in the past. Though that happened less in the regular season, eight of the first 11 goals and 12 of 20 overall against Vegas came on plays that made Jones move to his blocker side. That includes the lone goal, by Golden Knights center Jonathan Marchessault, in Jones' 58-save performance in Game 6, a rebound chance made tougher because he was off balance moving right and got up out of the butterfly on the wrong leg, delaying his ability to recover properly.
Traffic management:Jones gave up 18 screen goals in the regular season, below the average (21.2 percent) and down from last season (23) but was caught at times retreating deep into his crease behind traffic and dropping directly behind the screen rather than picking a side. It happened against Vegas too, with screens playing a role in six goals (30 percent).
---
Listen: New episode of NHL Fantasy on Ice