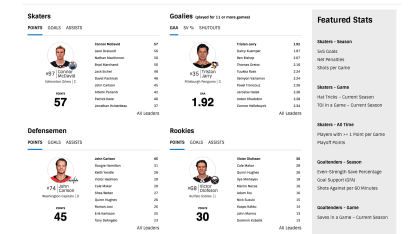
NHL.com launches revamped statistics section
Improved navigation, new goalie numbers among highlights

"Part of the goal was just wanting to better organize the site, part of it was wanting to innovate," said Timo Seppa, who was one of the lead developers of the redesign.
Among the highlights is improved navigation that separates skaters and goalies and a package of new stats for goalies. One tracks number of starts with a save percentage above .900, which is akin to the quality starts metric for baseball pitchers. The .900 save percentage was mark was chosen since the League average save percentage has dropped from .915 in 2015-16 to .910 through 483 games this season.
Connor Hellebuyck of the Winnipeg Jets, Darcy Kuemper of the Arizona Coyotes, Frederik Andersen of the Toronto Maple Leafs and Jordan Binnington of the St. Louis Blues lead the NHL with 19 starts with a .900 or better save percentage. But among goalies to start at least 10 games, Tristan Jarry of the Pittsburgh Penguins has the highest percentage of starts with a .900 or better save percentage at 83.3 percent (10 of 12).
Goalies also now can be tracked by complete game, percentage of complete games and incomplete games.
Among goalies to start at least 10 games, 15 have completed 100 percent of them. Anders Nilsson of the Ottawa Senators, Pekka Rinne of the Nashville Predators, Carter Hart of the Philadelphia Flyers, Jimmy Howard of the Detroit Red Wings and Martin Jones of the San Jose Sharks are tied for the NHL lead with three incomplete games -- games where another goalie also saw playing time.
Goalies also can be measured by how many goals their teams are scoring for them. An example of how that stat can be used is with Rinne and Juuse Saros, who have played about the same amount of games (18 for Rinne, 16 for Saros), and similar save percentages (.893 for Rinne, .894 for Saros), but Rinne has 10 wins to four for Saros, in part because the Predators are scoring 4.09 goals per game for Rinne but 2.35 per game for Saros.
The debate about whether goalies should play both games of a back-to-back will be quantified with a new stat showing save percentage based on days rest. Mackenzie Blackwood of the New Jersey Devils has played each game of a back-to-back a League-high five times. He has an .887 save percentage in those games but has a .922 save percentage in the five games he's played after one day of rest.
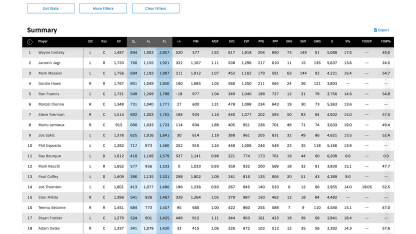
Team stats also have been tweaked to include franchise totals rather than team totals. So anyone interested in seeing who the all-time leading scorer for the New Jersey Devils only has to check one place, rather than look separately for Colorado Rockies and Kansas City Scouts numbers. Defunct franchises remain searchable in the updated format.
New team stats views include net power-play percentage and net penalty-killing percentage, which take into account how many shorthanded goals-against a power play concedes and how many shorthanded goals a penalty kill scores. The Arizona Coyotes last season were third in the NHL with an 85.0 percent penalty kill, but taking into account their 16 shorthanded goals scored, their 92.0 net penalty-killing percentage was the fifth-best in League history.
The stats also are better organized to make for a better fan experience. For example, anyone checking face-off statistics now will see overall winning percentage, winning percentage by man-power and winning percentage by zone aligned in side-by-side columns.
"We were shooting for a curated experience, to give you key information side by side, providing insights at a glance that you wouldn't see by just looking at one stat," Seppa said.
All stats can be checked historically by single season, multiple season or game-by-game depending on when they became official. Running on the SAP S/4 HANA Cloud, NHL.com/stats allows fans to customize statistical searches across the complete history of the NHL since 1917.

Many stats also are now presented on a per-60 minutes basis, in addition to goaltending results based on starts vs. relief appearances, skater shooting percentage based on type of shot and on-ice goals-for/goals-against for skaters. There's also an enhanced glossary for any fans who might need further explanation or clarity.
There could be more innovations added in the future as information from Puck and Player Tracking is eventually integrated.
"Statistics are the building blocks of the NHL's history," said Russell Levine, the NHL's Group Vice President of Stats and Information. "The goal of this redesign is to better present that history to our fans and to bring them a deeper understanding of the game and to put players' achievements into historical context."


