Fleury Holtby matchup

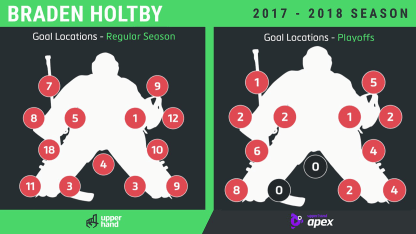
Goaltending is an integral part of the Stanley Cup Playoffs. To better understand the strengths and weaknesses of the goaltenders in the Stanley Cup Final, the final 100 goals allowed by each in the regular season and each goal allowed in the playoffs were charted, with the help of Apex Video Analysis and Save Review System from Upper Hand Inc., to see what patterns emerge.
There will be plenty of ties between the goaltenders and their coaches when the Vegas Golden Knights play the Washington Capitals in the Stanley Cup Final.

Vegas goaltending coach Dave Prior worked for Washington from 1997-2013 (16 seasons) before being fired because he didn't want to implement the changes coach Adam Oates wanted to make in Braden Holtby's style and approach. Three years later, after Capitals goaltending coach Mitch Korn made some of those changes, among others, Holtby won the 2016 Vezina Trophy as the NHL's top goaltender.
Prior was hired as the Golden Knights director of goaltending on Aug. 10, 2016, and, using those same positional principles he refused to compromise in Washington, has helped Marc-Andre Fleury to the best season of his NHL career. It's proof that there isn't one way to play the position and makes for a compelling storyline when Fleury and Holtby meet in Game 1 at Vegas on Monday (8 p.m. ET; NBC, CBC, SN, TVAS).

Marc-Andre Fleury, Vegas Golden Knights

Fleury is more aggressive with his positioning under Prior, but don't confuse that with the puck-chasing habits that led to meltdowns in the Stanley Cup Playoffs with the Pittsburgh Penguins from 2010-13. He has blended the improved post integration that helped turn around his career in Pittsburgh with Prior's positional preferences and is leading the NHL with a 1.68 goals-against average and .947 save percentage in the playoffs. But as Fleury plays more outside his crease, there are targetable trends, some of which have been exploited.
Goal trends
Off the rush: Prior wants his goalie to hold his ground rather than flow backward with the rush, and as fast as Fleury is, he can be attacked with lateral plays. Of the more than 3,500 goals tracked in breaking down playoff starting goalies for this project over the past two seasons, 38.5 percent were scored off the rush compared to end-zone play (61.5 percent). Fleury has allowed 49 percent off the rush in the regular season, and though that is down to 26 percent in the playoffs, four of the 10 goals scored by the Winnipeg Jets in the Western Conference Final came off the rush or quickly after setting up in the end zone. Vegas was slow to sort out defensive coverage on a lot of the goals in the regular season, and that continued with Mark Scheifele's backdoor goal in Game 3 and Tyler Myers' low-high goal in Game 4. Fleury's positioning outside his posts also played a role in the regular season, leaving more lateral distance to recover.
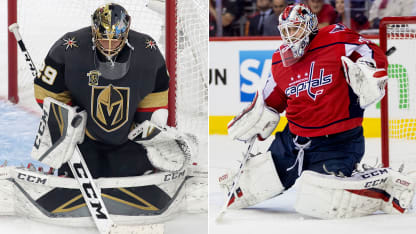
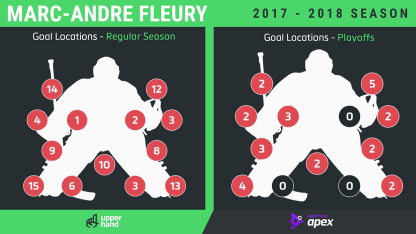
Fleury chart

One-timers: Patrick Laine also took advantage of the extra distance Fleury has to move coming across with two power-play goals on one-timers off cross-ice passes. Fleury tends to back into these plays moving right, initiating the movement with a quick backward C-cut on his right skate, a slight delay to build momentum that helps explain why 16 percent of Fleury's goals allowed in the playoffs have come from outside the face-off circle and home plate area on his blocker side compared to zero on his glove side. It's something the Capitals may be able to take advantage of with Alex Ovechkin's one-timer from the left face-off circle.
Below the goal line: The San Jose Sharks scored three goals off wraparounds in the Western Conference Second Round, and another on a pass from below the goal line. That trend continued facing Winnipeg with four goals on plays from behind the net or sharp angles, including Kyle Connor's goal from low in the left circle in Game 2. Fleury's sharp-angle and low-high numbers weren't markedly worse than average in the regular season, but he's allowed 10 of 27 goals (37 percent) on these types of plays in the playoffs, mostly when moving to his right.

Braden Holtby, Washington Capitals

Holtby struggled late in the regular season and was the backup to start the playoffs, but he has bounced back nicely since replacing Philipp Grubauer in Game 2 of the Eastern Conference First Round against the Columbus Blue Jackets. He had two straight shutouts against the Tampa Bay Lighting to close the Eastern Conference Final, and with a .924 save percentage has looked more like the goalie who won the Vezina Trophy. He's done so by combining the explosive power that defined him early in his career with a more controlled game plan implemented by Korn to leave him less reliant on that physical skill.
Goal trends
Cross ice and quick: Holtby was better than the tracked average during the regular season with 33 percent of his goals coming after the puck was passed or carried across the slot, an imaginary line that divides the offensive zone from the goal line to the top of the face-off circles. That jumped to 43 percent after Tampa Bay scored nine of 15 goals on these lateral plays, which are more difficult for a goalie because he has to change his angle completely to square up after the puck moves from one side to the other. The Lightning exploited cross-ice seams on their power play, scoring six times with another goal shortly after a power play expired. In addition to quick lateral puck movement, fake shots and deception are important against Holtby because as quick as he is, he relies more on reads laterally than tracking the puck, and there were times against Tampa Bay he was late getting across as a result.

Holtby chart

Deflections against the grain: Deflections played a role in 12 of 23 goals (52 percent) against Holtby in the first two rounds, well above his 18 percent in the regular season and the 20.5 percent NHL average, but Tampa Bay scored one deflection goal. Holtby's tendency to push his body into a shot rather than reaching, which is usually considered a strength, can be turned into a liability if you catch him moving the wrong way with a deflection.
Along the ice: Goals along the ice are often associated with tap-ins after cross-ice passes, but Holtby has additional exposure on low shots through screens (22 percent of his goals in the regular season and 33.3 percent in the playoffs) because his narrow butterfly reduces low coverage. It is tied to his upright torso, which also creates a delay in recovery movements, with the lead pad pulling back and out of the way before he pushes, leaving him susceptible to quick, low shots on rebounds. Holtby has allowed 12 goals in the playoffs from outside his skates.